Dorron Levy and Ram Chillarege
Comverse Technology Inc., and Chillarege Inc.
Published in: Proceedings IEEE International Symposium on Software Reliability Engineering, ISSRE 2003, Denver, CO, Nov 17-20, 2003.
Introduction
Achieving a desired level of software reliability is a key driver to customer satisfaction. No one method, alone, can guarantee results but we know that constant measurement and improvement are key ingredients of success. Traditional research has focused on certain segments of this life cycle more than others: such as fault-tolerant design and testing, as evidenced by conferences and papers that abound in these topics. A matter that is probably less discussed is the field response and customer service, albeit not necessarily under the purview of the area of maintenance. This is a borderline between operations and maintenance. As systems grow and complexity explodes this topic elevates in importance. Early research on failure logs developed models to characterize failures which could then be used for early warning [1,2]. Over the next several years there was considerable interest in areas such as anomaly detection which helped diagnose failure, identify intrusions, and alert operations [3,4]. The importance of such methods has grown since distributed systems can have partial failures, reduced performance and unreachability of services, yet linger in a degraded mode far longer. With redundancy in services and interconnections, diagnosis is harder and early warning becomes crucial.In recent literature the notion of rejuvenation [5,6] has brought into discussion another reason to develop better predictors of system failure. The concept of rejuvenation can be summarized thus: As system failure becomes imminent, either due to depletion of system resources, or other failing subsytems, a restart of a system can enhance overall availability. This idea has gained commercial viability as evidenced by the IBM Director xSeries servers incorporating the technology [7]. A similar thought, called "Failure Prevention and Error Repair", was proposed several years ago to clear the system of "hazards" that were known to develop in fault-injection experiments on large IBM systems [8]. The hazards occur due to error conditions that accumulate, and system availability can be enhanced by a restart or cleanup of the hazards. Another recent development is the concept of "autonomic computing", championed by IBM [9]. Clearly the border between operational problems, service degradation, partial failures, and system failure has blurred. Underlying these trends, the technology to recognize impending failure becomes the corner stone to building and operating reliable systems. While the capability of automatic diagnosis of unit failures, both in hardware and software have existed in the industry for several years, that is no longer adequate to meet the new needs. We need a higher level capability where the overall system health can be monitored and suitably drilled down. This challenge is not a simple extension of the earlier methods, since information that is collected needs a different level of analysis and has to deal with signal to noise ratios that are substantially different. Essentially, the more timely the warning and broader its scope, the greater its value. Early research in this area has recognized the critical role empirical analysis plays. At AT&T 5ESS logs have been rigorously studied to reveal information in potential problems. Graphical analysis of logs [17] aids in identifying patterns. Such exploratory data analysis is the first step before model based analysis [18] techniques can be developed. In recent years several mainstream analysis tool vendors such as SAS, and SPSS have focused on visual analysis rendition of empirical data. Beyond the visualization and before the rigorous analytical model there is a question of strategy. And strategy is best guided with principles. Our work, is focused on distilling a few principles. Principles that can find application in another domain but dealing with a similar problem - certainly the specifics, models and methods would vary but the hope is that the principles will guide the researches and find application once again. The specifics of this paper deal with a flood of realtime alarm data that is generated in a Telcom application where availabilities of up to 99.999% are expected and downtime events are carefully managed. The data has a wealth of information burried in it, if it can only be deciphered quickly to aid customer services. Our principles have helped build a system that is functional today and working globally dealing with a multitude of situations and constantly evolving needs. Thus there is a constant need to improve the process itself, much like improvements done in design [19]. And we find that the principles we describe are a constant guide to the engineers. Section II describes Comverse Technologies's Trilogue which is our case study. Section III describes alarm based early warning, and Section IV a summary of the contributions.
Case Study
The work is reported using data from Comverse Trilogue voice mail systems. Comverse is a Telecom Capital Equipment company and supplier of enhanced services for telecommunication service providers. Typically these enhanced services include voicemail and Short Message Service (SMS). With over 400 telecom service providers, servicing 300,000,000 subscribers in 100 countries, Comverse systems enjoy a market leader position.
Requirements
The Telecom market requires extremely high availability from its vendor's products. Systems are designed with several layers of redundancy, monitoring and robustness. In case of failure, large support organizations are mobilized to ensure quick return to service. A typical vendor's response time to failure is expected to be no more than 15 minutes, 24 hours a day, 7 days a week, anywhere. Combining this responsiveness with a globally installed base of complex systems makes technical support a considerable challenge. With the short response time demanded in this industry sector, early warnings of abnormal system behavior are highly valuable. This is why there is a clear need to develop a general health criteria that communicates system health in addition to specific failure mechanisms. Technical support organizations require the earliest possible warning, with minimal effort dedicated to activation and maintenance of the early-warning system. This can be achieved with a health-criteria type of warning, where the organization invokes its technical resources for the exact troubleshooting before actual system failure takes place.
System Architecture
The Trilogue INfinity system from Comverse [10] handles voice mail for large telephone service providers. The system consists of tens of distributed servers connected via a high-speed backbone network. This structure achieves significant scalability from small systems that handle 50,000 subscribers to large networks that handle over 50 million subscribers. Figure 1 shows some of the key sub-systems that make up the system structure. Calls come in from the Public Telephone System Network (PSTN) to a call control server (CCS) which handles the network signaling for all the components in the system. The Trilogue Manager (TRM) is the control unit for all the messaging units and provides an access point for external interfaces such as administration, billing and alarms. Messages are stored in the Messaging and Storage Unit (MSU), which is designed to be redundant and scalable. The Multimedia Unit (MMU) is telephony front-end for voice and fax, and handles functions of user interaction. All these units are connected on a high-speed backbone, built up of high speed LANs that are redundant and scalable. It allows for full connectivity among the units.
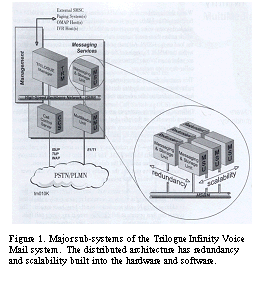
Hardware redundancy in MSU is built-up by one or more methods depending on individual requirements. The choices are (a) active/standby, where a standby unit automatically takes over its operations within a few minutes. (b) Load-sharing (n+1), where the system capacity is maintained following single failure. (c) Disk mirroring where mission critical information is maintained providing uninterrupted services in the event of a disk failure. The success of complex systems in the demanding Telecommunication environment depends on several layers of reliability design. While the redundancy in hardware and distributed capability provide a level of scalability and reliability, there needs to be another layer of online monitoring and management of the system. Such monitoring can deal with a broad class of failures such as software, systems, operations and environmental
The Alarm System
A design point for this higher layer of online monitorinEarly Warning of Failures through Alarm Analysis - A Case Study in Telecom Voice Mail Systems and management is handled through a system of tri-level alarms. Alarms can be Critical, Major, or Minor to signify the different levels of severity of a situation. An operator can set alarm thresholds and when the monitored inputs exceed defined thresholds an alarm is triggered. It is important to distinguish an alarm from a system failure. Alarms are introduced into the system at several points around the system's life cycle: During development, developers introduce alarms in order to ease troubleshooting and debugging. When alarms are not needed anymore, they are rarely removed. Customers request alarm, typically to alert specific conditions. These alarms may be activated by either one or more conditions that are set up by operators. The operators also have the capability to not enable alarms - or do so with limits of their choosing. Eventually, most systems have hundreds of alarms with only few - those that are clearly related to failure - being attended. Thus one cannot take the alarm feed and directly transform it into a dashboard of system health. In fact, when doing so, we may find that limits set in one customer location may not directly translate to those in another. However, the large population of alarms types and counts suggests that statistical tools may retrieve useful patterns [11]. In real-life maintenance, most alarms (typically>95%) are disregarded. Typically single alarms do not give the operating or maintenance bodies enough information for action; some of the alarms will auto-reset in matter of seconds; other give information that may be of interest when debugging a specific software element, but have no system-level value; significant alarms typically appear too late for preventing system failure. On the other hand, our experience shows that even basic statistical analysis of alarms, i.e., counts, lead to much more significant information on system status. Monitoring the number of alarms that a system produces, for example, on a daily basis, provides a low baseline with increases easily correlated to assignable cause via alarm type; comparing identical units alarms output points towards suspected units, that should be checked; this simple analysis can be done over a system, subsystem, or even at the customer (multiple system) or the product level. A more advanced realization uses count clusters of alarms that are related to common field failures. The system produces alerts for specific failure in a specific sub-unit, easing troubleshooting significantly.
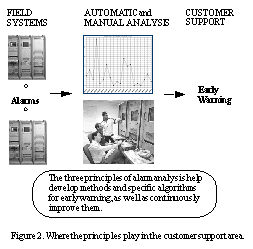
We have packaged the alarms monitoring and basic analysis capabilities into a web-based product, named ARISTO [14-15] that is used by Comverse support personnel and is sold to customers for their own monitoring applications. Field experience is encouraging, with customer's awareness leading to quick and significant increase in overall system reliability as evidenced by decreasing downtime and time-to-repair.
Alarm based Early Warning
Early warnings alert can be of two types:
- General alert: Something is wrong, attention is required ("health criteria")
- Specific alert: A certain failure mechanism is expected in the near future
In a technical support organization with a large staff, and the business tolerating only very short downtime, getting a general warning, with a high degree of confidence sooner, allows the deployment of the right skills and the planning of intervention. When an alert is generated, support staff invokes specific troubleshooting routines, usually covering a significant number of typical failures efficiently. In order for a general alert to be useful, it needs to have typical normal values during `healthy' conditions, and to react quickly to `sick' conditions. We have studied the use of alarms distribution of the TRILOGUE INfinity system, as a mean to achieve early warning for system failure. During normal operating conditions the number of alarms that are produced by a system, and the distribution of the alarms leave a signature characterizing a particular configuration and customer set. The number of alarms produced by a specific unit such as an MMU or MSU can be different between customer configurations - simply because there may be different configurations, the utilization rates can be different and finally the thresholds set by the operators of each network can also be different. However, between weeks or months, the patterns emerge and they tend to be stationary barring a developing problem or a significant shift in the volume of messages.

However, what we have found is that for a particular customer there it is possible to detect a "normalcy" in the behavior of alarms. This normalcy can be learnt, and departures from the normalcy become indicators of a problem or the development of a problem. This shift in the signature becomes the health monitor that can be profitably used. We have captured these learnings into three general principles that we will discuss. Each principle can be viewed as a basis to formulate specific algorithms that can be tuned, modeled or further analyzed. Advancing from Principle 1 to Principle 3 also provides a natural way to segregate the alerts along the two broad classes, namely general alert and specific alert. One of the values of establishing principles for analysis as opposed to rigid algorithms is their flexibility and adaptability to changing environments. For example, an environment may experience an unusual volume of information messages that do not relate to failure, since an operator turned them on but forgot to turn them off. Such changes in the feeds should not alone invoke the warning system. This principle based system has been robust to number of such situations.
Principle 1. - Counts Tell
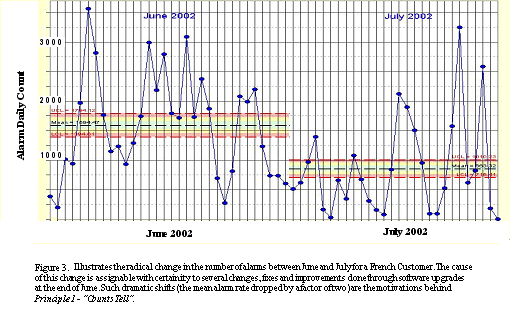
We first start with the simplest of approaches. The mere counting of alarms and averaging them over time, has been found to be an excellent indicator of issues. Figure 3 shows the daily count of alarms at a European customer, during the months of June and July 2002. Against the data we have also indicated the lower and upper control limits during each month. What is immediately apparent is that there has been a substantial lowering in the number of alarms from June to July.

During the month of June the customer had experienced many issues, eventually to be sourced in the customer's infrastructure (so that Comverse's alarms could not directly detect the problem). A task force handled the issues, which were addressed with repairs, and the difference is visible in the following months. What this experiment showed us is that, regardless of the settings of the alarms, when we average the behavior over a period of time, we can establish an expectation on the numbers of alarms. Shifts from that mean indicate a variance. A larger number of messages, indicates a developing problem, while a lowering is indicative of a fix. As the alarm data and analysis are available to the customer via the ARISTO tool they have the advantage of responding to situations faster. Figure 4 illustrates the consequence of merely introducing the tool. The period identified as "pre launch" shows a fairly large number of alarms. Soon after the tool was launched we see that the large number of minor alarms have been corrected, reducing the overall alarms, and correspondingly the number of major and critical alarms too. While no sophisticated analysis was necessary in this case, it illustrates one of the side effects of measurement and the human reaction to it. Regardless, it contributed to higher reliability and lower downtime. Another useful approach is to count the number of alarms generated by each identical unit, i.e., all the MSU's of a certain system. Figure 5. shows that MSU19 is significantly worse than its' peers, and requires maintenance attention. .

We will use this principle, to dig deeper into the nature of the messages.
Principle 2 - The Mix Changes
Each of the subsystems generates alarms. For instance, with reference to the system architecture Figure 1, alarms are generated by TRM, MSU, MMU, etc. The alarms are coded with numbers related to sub-units, so a follow up of possible problem areas is relatively easily achieved. When a subsystem generates relatively large number of alarms, the deployed support personnel can investigate and issue corrective action before the systems other protections, i.e., redundancy, give up and fail. We now take the total number of alarms that are produced by a configuration and look at the distribution of the different components that generated the alarm. One way to represent this distribution is to look at the Pareto distribution - where the order of the bars is ranked by their probability.
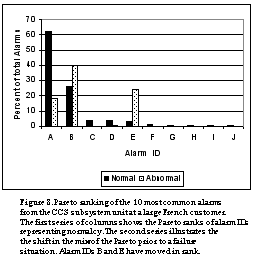
Within a particular customer setting, we find that normalcy can be described by the Pareto distribution being stationary. Which means that the order by which the different subsystems appear in the Pareto tends to be fairly well established. The distributions do not always remain the same among customers - largely because of difference in configuration and operator preferences in setting alarm thresholds. However, experienced customer services personnel have noted that there are some second order patterns that are discernible among systems When failure develops, we find that there are one or two changes that occur. The number of alarms from some of the subsystems changes - either up or down. And as a consequence, the order of where that sub-system appears in the pareto distribution also changes. This is particularly interesting since we can often detect changes in the order of the pareto distribution more easily than we can in the total number of messages - especially when the shifts are subtle. When the shifts are large, then we can detect both Figures 6 and 7 illustrate this shift. Data for Figure 6. was when the installation had no problems and Figure 7. when there was a problem. Not only are the number of alarms higher, but the relative shift in Pareto order identifed that the RCCS sub-unit had a problem. This shift is particularly sensitive, especially since it can work even when units go unusually silent with alarms, or increase in count. As we show later, it also provide significant early warning.

When the alarms of a single unit are monitored, a picture like that shown in Figure 8 typical: The blue (or light grey) columns represent typical working day, when status-related alarms are dominant. The red columns (or dark grey) distribution appears few hours before a downtime event, with ranking order change. Although not visible in this graph, the number of alarms also jumped up by an order of magnitude. So deviations from normal behavior are indicated by both number increase and ranking order change. Experience shows that this method is sensitive to immediate indication of problem onset.
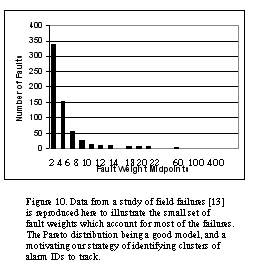
Figure 9 illustrates the early warning shown along a temporal scale. The overall number of alarms is normally low, but when a significant increase occurs, it is typically related to a specific component and alarm type, leading to assignable cause for the alarm count increase. This simple analysis is used by the maintenance personnel as actionable data: Figure 9 consists of field data acquired during beta test, and while the MSU was fixed, the CCS was intentionally not attended, resulting in an (avoidable) downtime on the 26th.
Principle 3. Clusters Form Early
Relating alarms to each other in order to achieve significant patterns is a well known method and is the subject of several data mining techniques. Typically large sets of alarms are analyzed using specific constraints and models (i.e., network models) in order to detect significant alarm correlations [11]. However, practical applications of data mining results are limited by the large number of results, limiting the ability to distinguish useful rules from the results of datamining [12]. Additionally, the ability to distinguish useful results from correlation of alarms to exact failures is often limited by the knowledge of failures. The reality of the field service business is often optimized towards speed of solutions and not completeness of analysis, which further defeats gathering useful information to aid in data mining. Our approach departs from rigorous data-mining analysis by focusing only on field problems that are most important for the user and vendor, exploiting accumulated experience with problems and their resolution. But before describe the methods, we will first discuss some background facts about failures, which provide us the intuition and motivate for the method of our choice.
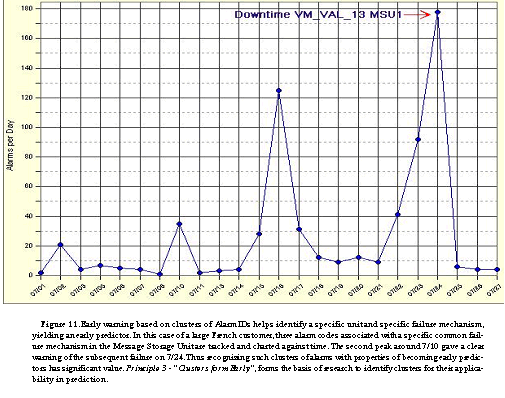
A widely accepted notion of field failures is that they tend to follow a Pareto distribution (often called the "90-10" rule). While the belief is widespread, we prefer to use real data to corroborate the position. A study on a widely distributed software system examined failures and causes in the field [13]. For convenience, we reproduce the chart in Figure 10 from this study. Notice that field failures fit the Zipf law[20], which is equivalent to Pareto distribution, as both follow power law of  . It follows that early warning of a small number of specific failure mechanisms can lead to practical early warning of most field failure occurrences. In most support organizations rare problems are automatically transferred to expert groups, where they are efficiently handled. For the operations manager in a telecom company, or the maintenance personnel of a telecom vendor, there is a lot of value in the ability to get an early warning on the 10% of causes that create 90% of field failures - and to be able to mobilize the expert group when the system indicates "unhealthy" conditions with no resemblance of a common problem. Armed with the knowledge of the nature of failures, our design point shifted to leveraging experience from research, development and field personnel. Specific failure mechanisms are often accompanied by significant rise in the quantity of several specific alarms. We define the set of alarms that is typical to a failure mechanism as a cluster. As explained, we are interested in the clusters that follow only the most common failure mechanisms. In order to identify the clusters, several techniques may be employed: Analyze historical data of alarms around the time of common failures, interview R&D and field personnel for their experience (as reference 11 recommends), and look even for correlations with no apparent causality (i.e., an interruption in one part of the system may generate a flood of alarms in different parts). Experience shows that the process is straight forward, and the result combine extremely low rate of `false-positive' with long warning window. In case of important failures mechanism without specific alarms or clusters, code writers may add specific alarms to note the failure mechanism; it is often easier and faster than full bug correction, and acts as `stop-gap' until thebug is fixed. Figure 11. illustrates the increase of a specific MSU cluster (formed by three alarm ids) showing a series of increasingly higher peaks resulting in a downtime event (the highest peak on the right). In this case, the downtime could have been avoided by handling the specific MSU more than a week in advance.
Summary
This paper studies an important issue in today's distributed and complex systems, namely the early warning and isolation of impending failure. While the need for this is quite often implemented at a device level (e.g. S.M.A.R.T. for disks [16]), its application at a large system level for on-line monitoring, diagnosis and repair is quite ad-hoc. We present the principles and application of a practical approach to address this issue using alarm processing. The concepts are implemented in Comverse's Trilogue Voice Mail system that currently services over 300,000,000 users world wide. Our findings illustrate that three principles, when carefully applied, demonstrate the capability to achieve early warning of system failure.
- Principle 1: Counts Tell -- The overall counts of alarms rise quite significantly foretelling an impending failure. At a high level, this provides a general warning, albeit may not be specific to specific sub-unit. The advantage of general warnings are that they alert operations and maintenance staff who can potentially avert a failure.
- Principle 2: The Mix Changes -- The Pareto distribution by sub-unit has a rank order that is often a signature of normalcy for a customer. When the rank order of this pareto changes, it marks the sub-unit that is problematic. This change is a powerful tool, since it captures both fail-silent (alarm) sub-units and those where the alarm counts rise. It has demonstrated early warning in the range of days, which carries significant merit in the Telecom industry.
- Principle 3: Clusters Form Early -- We find that groups of alarm codes form a cluster that collectively indicate a failing sub-unit. This cluster count rises quite early, and may sub-side temporarily - but leaves a trail that flags an impending failure. Several of these clusters are recognized by the research, development and customer service groups. Once recognized, they are tracked across to yield good early warning systems.
These principles have been illustrated with seven examples drawn from a world wide base of customer experiences. We have found that the application of these methods have decreased mean time to repair (MTTR) by greater than a factor of two, and correspondingly decreased un-availability. We hope that these ideas and data will provide practitioners guidance and researchers a basis to extend concepts, and formulate new theories and methods.
Acknowledgments
Many people from Comverse Customer Support deaprtment have contributed to make this possible and we greatly appreciate their help. We thank Comverse Technology Inc. for the support of this work.
References:
- Xavier Castillo, Stephen R. McConnel, Daniel P. Siewiorek: "Derivation and Calibration of a Transient Error Reliability Model", IEEE Transactions on Computers Vol. 31 No. 7, 1982, pp. 658-671.
- R.K. Iyer, D.J. Rossetti, "Effect of System Workload on Operating System Reliability: A Study on IBM 3081", Transactions on Software Engineering, Vol. 11, No. 12: 1985 pp. 1438-1448.
- R.A. Maxion, "Anomaly Detection for Diagnosis," in Proc. of 20th IEEE Intl. Symposium on Fault Tolerant Computing, 1990.
- A. Avritzer and E.J. Weyuker, "Monitoring smoothly degrading systems for increased dependability," Empirical Software Engineering Journal, Vol 2, No. 1,1997, pp. 59-77.
- Y. Huang, C. Kintala, N. Kolettis, and N.D. Fulton, "Software Rejuvenation: Analysis, Module and Applications", Proceedings of the 25th Symposium on Fault Tolerant Computer Systems, Pasadena, CA June 1995 pp. 381-390.
- S. Garg, A. van Moorsel, K. Vaidyanathan, and K. Trivedi, "A Methodology for Detection and Estimation of Software Aging", Proceedings of the 9th International Symposium on Software Reliability Engineering, Paderborn, Germany November 1998, pp. 282-292.
- V. Castelli, R.E. Harper, P. Heidelberger, S.W. Hunter, K. S. Trivedi, K. Vaidyanathan,and W.P. Zeggert, "Proactive Management of Software Aging", IBM Journal of Research and Development, Vol 45, No. 2, March 201 pp. 311-332.
- Ram Chillarege, Nicholas S. Bowen, "Understanding Large Systems Failure - A Fault Injection Experiment", Digest 19th International Symposium on Fault-tolerant Computing, June 1989
- Paul Horn, "Autonomic Computing" IBM Research, Infoworld, April 22, 2003.
- Trilogue Infinity Product Description, Comverse Technology Inc., Wakefield MA 011880, 1999.
- K. Hartonen, M. Klemettinen, H. Mannila, P. Rokainen, H. Toivonen, "TASA: Telecommunications Alarm Sequence Analyzer, or how to enjoy faults in your network", IEEE/IFIP 1996 Network Operations and Management Symposium (NOMS96), Kyoto, Japan, April 1996, pp 520-529.
- Qungguo Zheng, Ke Xu, Weifeng Lv, Shilong Ma, "Intelligent Search of Correlated Alarms for GSM Networks with Model-based Constraints", Proc. 9th IEEE International Conference on Telecommunications, Beijing, China, June 2002, Vol 2, pp. 635-645.
- Ram Chillarege, Shriram Biyani and Jeannette Rosenthal, "Measurement of Failure Rate in Widely Distributed Software", Proceedings 25th International Symposium on Fault-Tolerant Computing, June 1995.
- Dorron Levy and Pier Tibika, "A Failure Prediction Method and Apparatus", U.S. Patent Application 09/996789 Nov 30, 2001
- ARISTO User Guide, Comverse Technology Inc., Wakefield MA 011880, 2003,
- Self-Monitoring, Analysis and Reporting Technology, S.M.A.R.T Working Group (SMG) 1995.
- Stephen G. Eick, Michael C. Nelson, Jeffery D. Schmidt, "Graphical Analysis of Computer Log Files", Communications of the ACM, 37(12): 50-56, Dec 1994.
- Kenny G. Gross, Vatsal Bharadwaj, Randy Bickford, "Proactive Detection of Software Aging Mechanisms, in Performance-Critical Computers", 27th Annual IEEE/NASA Software Engineering Symposium, Greenbelt, MD, Dec 2002.
- Lawrence G. Votta, Mary L. Zajac, "Using Process Waiver Data to Improve a Design Process: A Case Study of Feedback and Control Using the FEAST Model", Proceedings of the 10th International Software Process Workshop (ISPW `96), 1996.
- R. Gunther, L. Levitin, B. Shapiro, P. Wagner (1996), "Zipf's law and the effect of ranking on probability distributions", International Journal of Theoretical Physics, 35(2):395-417